
Sea Ice Concentration
Current Arctic and Antarctic sea-ice extent, concentration, anomalies, trends and higher-resolution products.
Latest Sea Ice Index Values
Daily extent in millions of square kilometers, compared with the 1981–2010 daily average.
Current Extent & Concentration
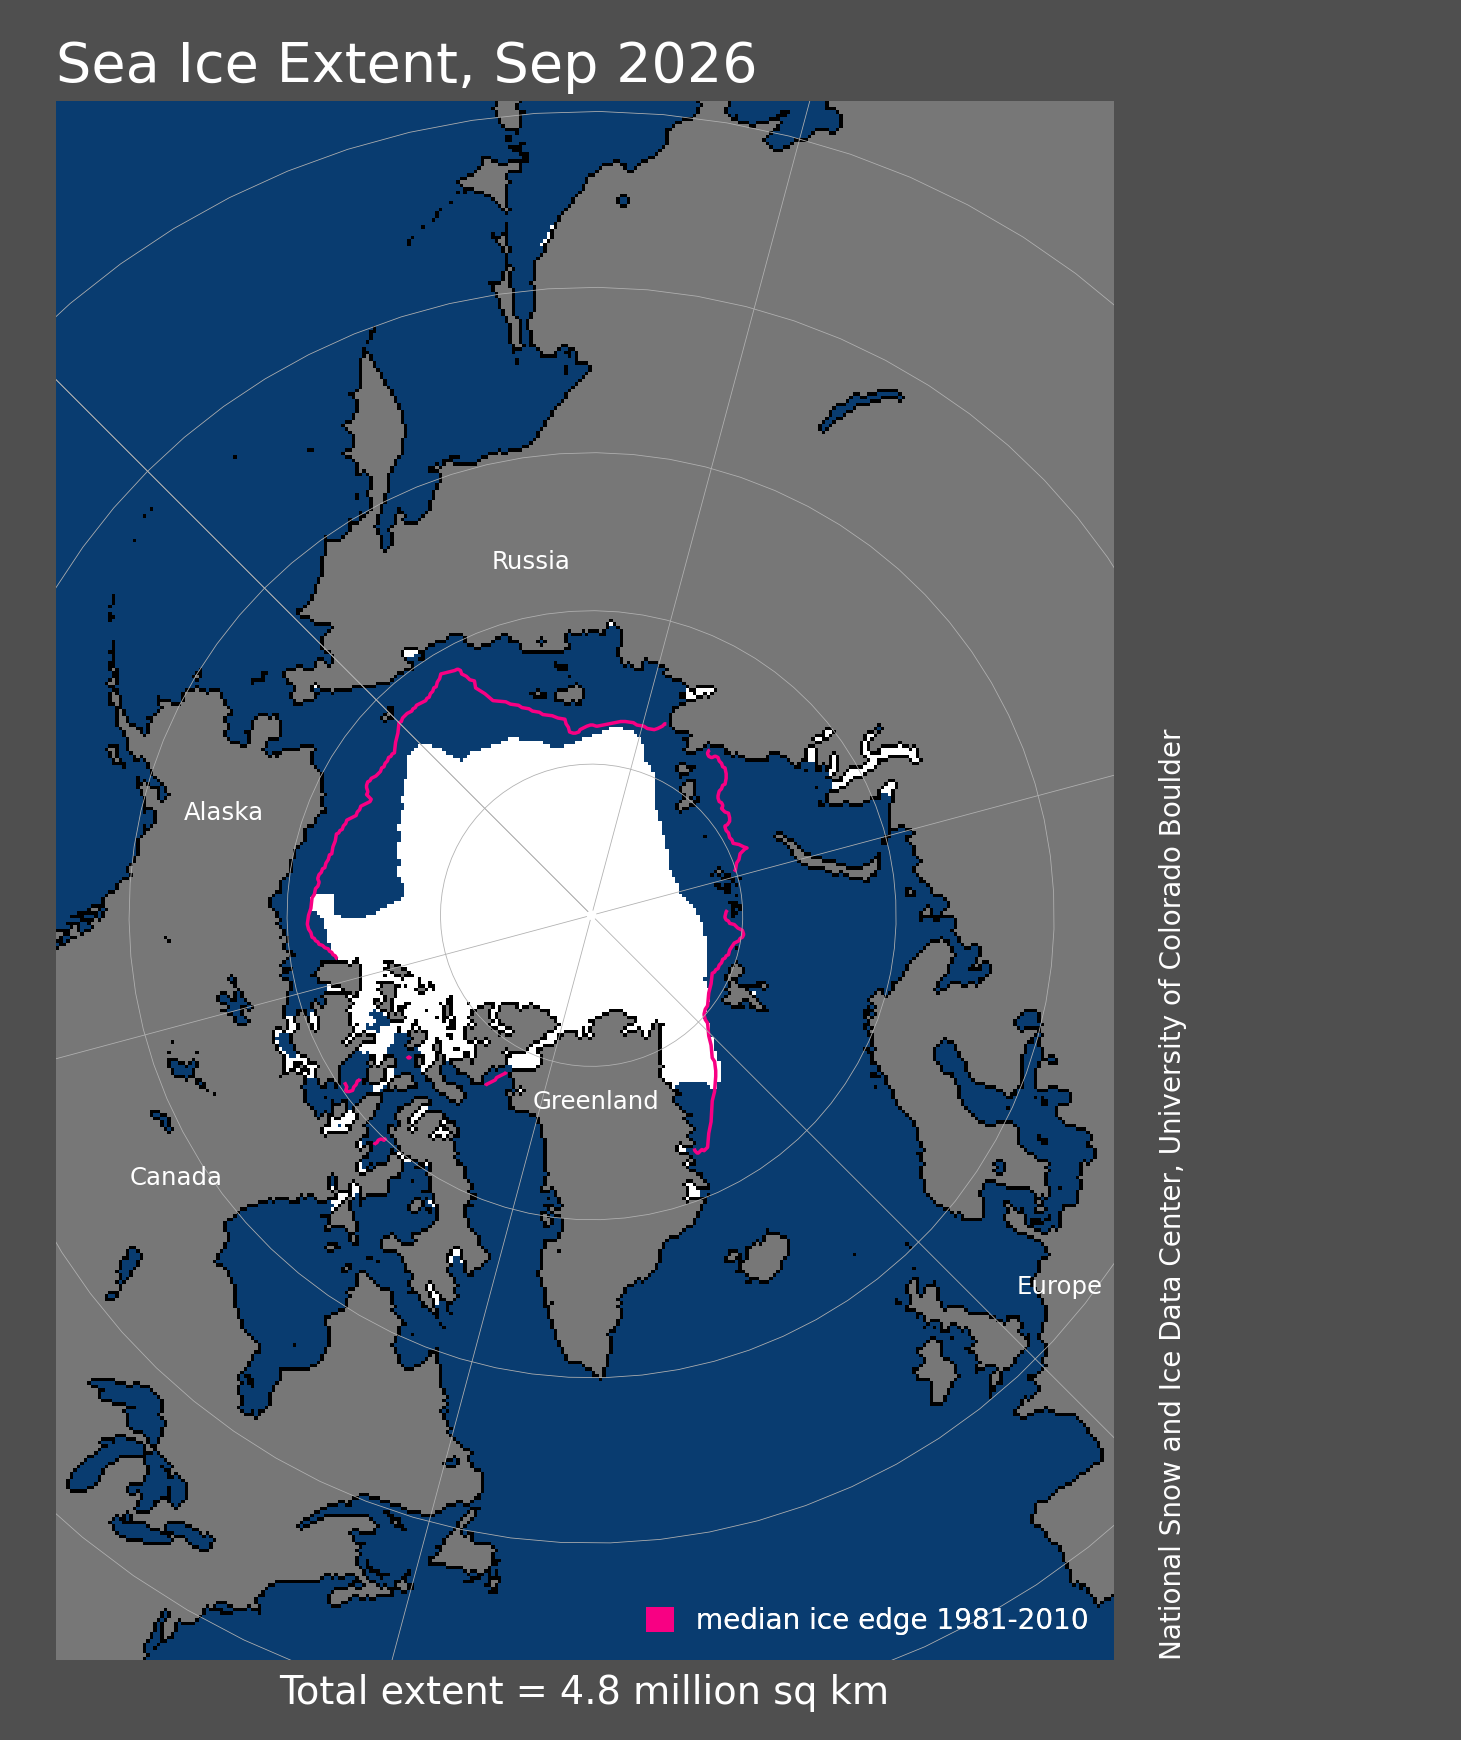
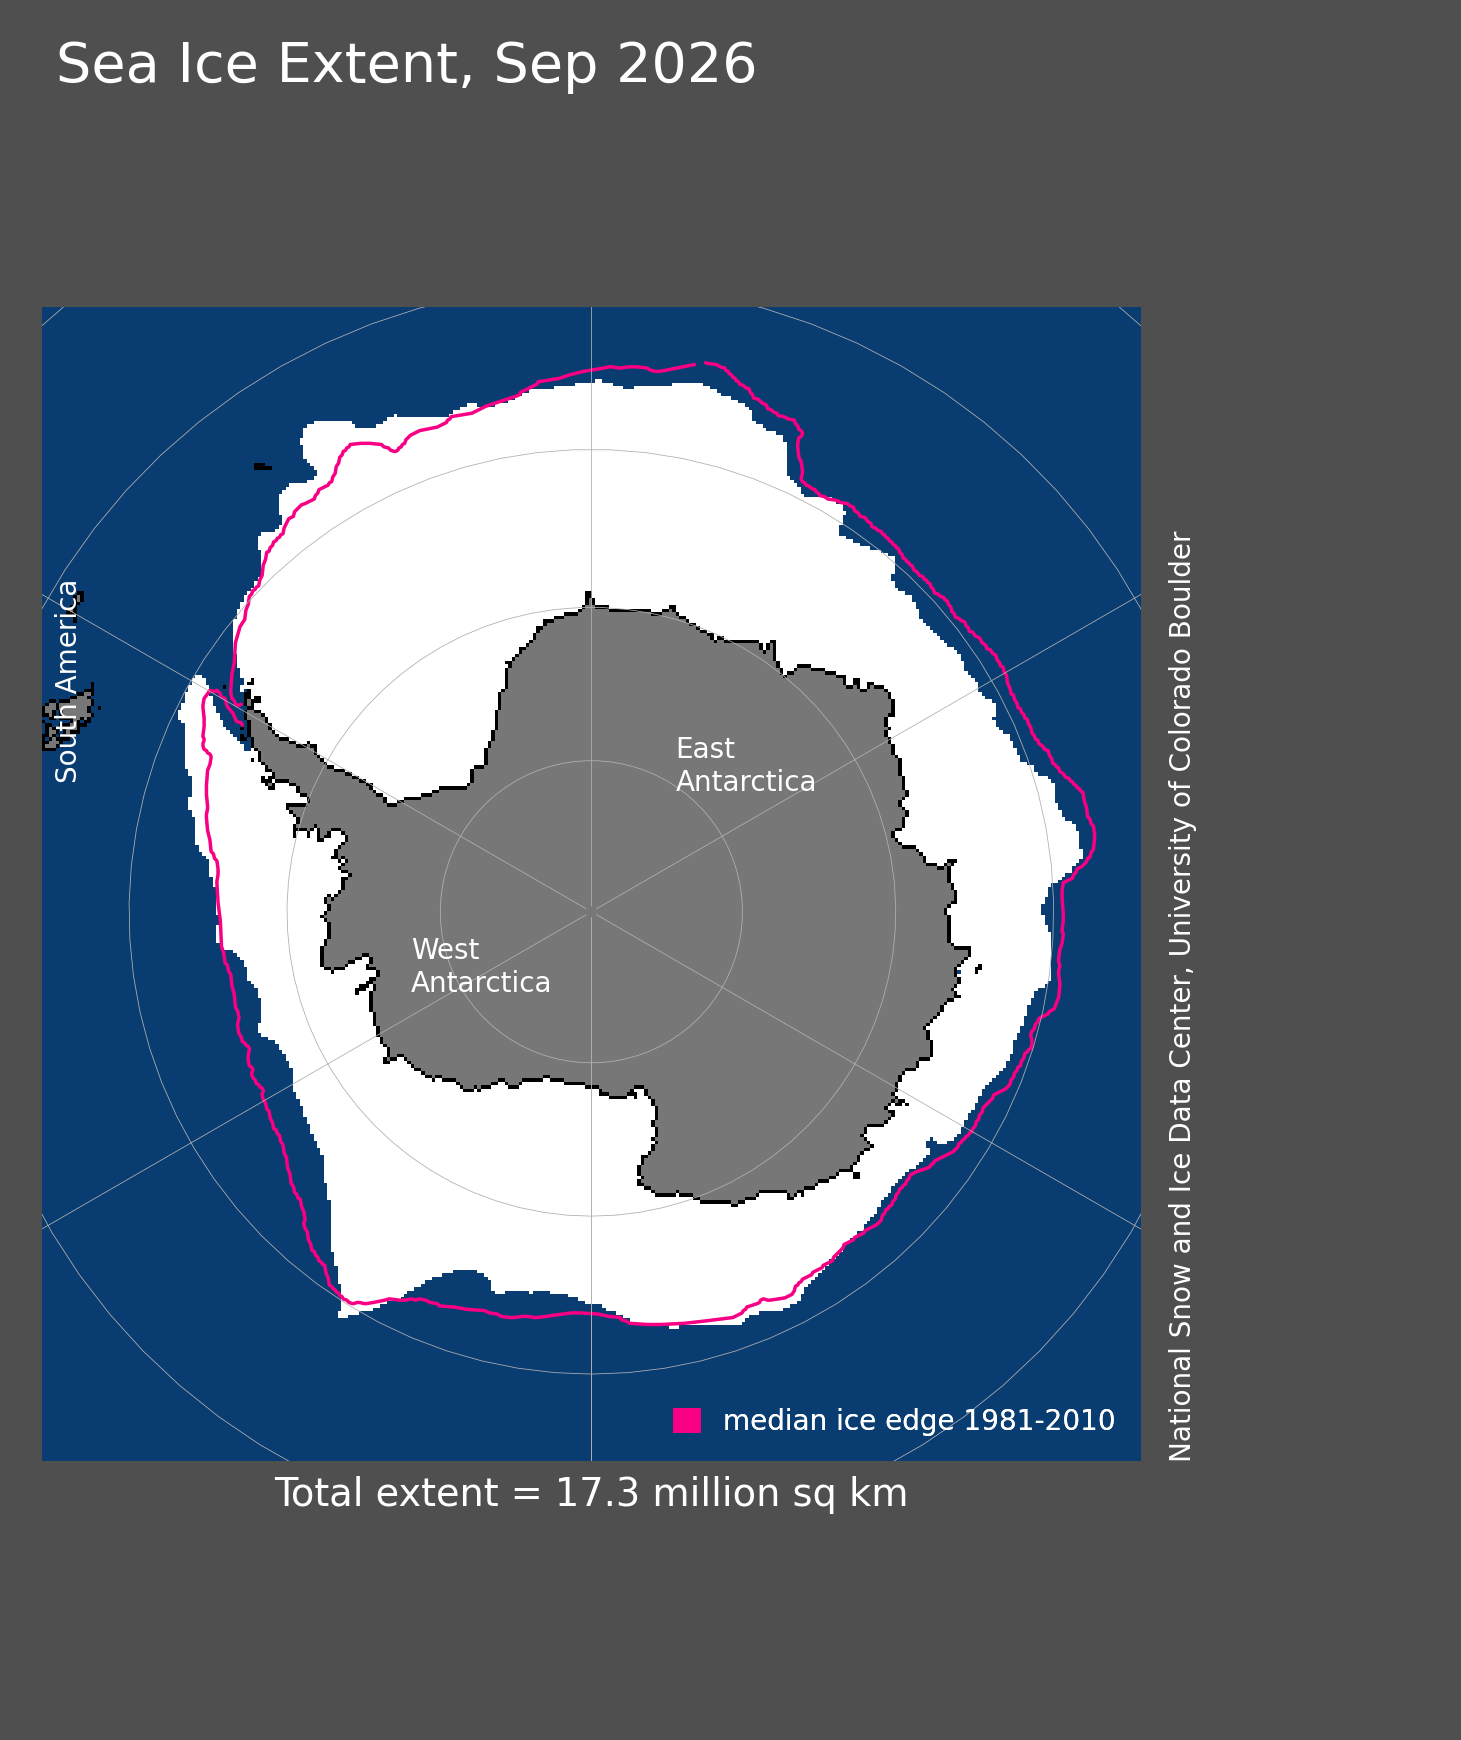
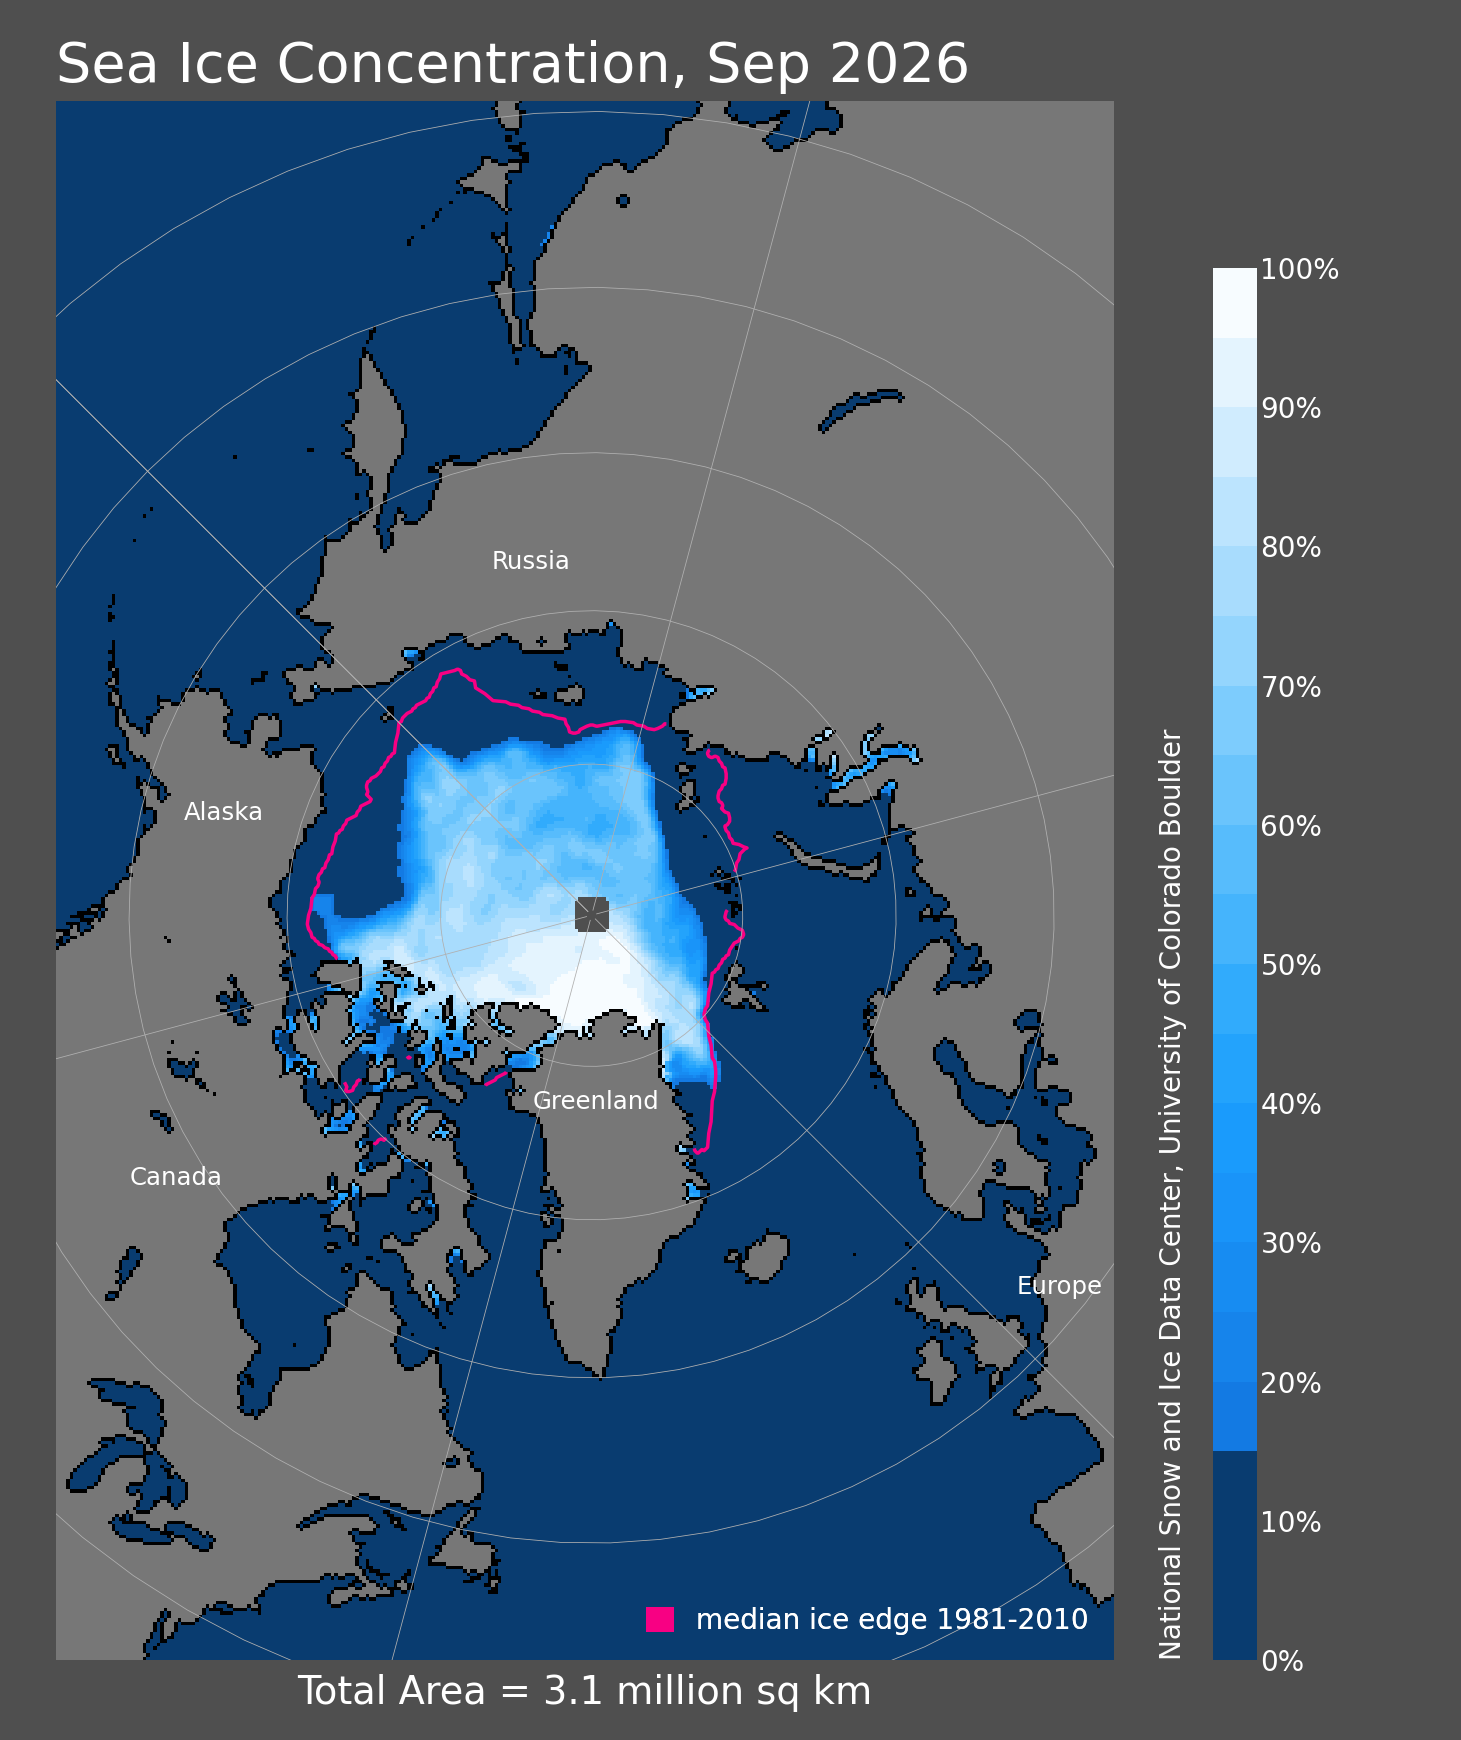
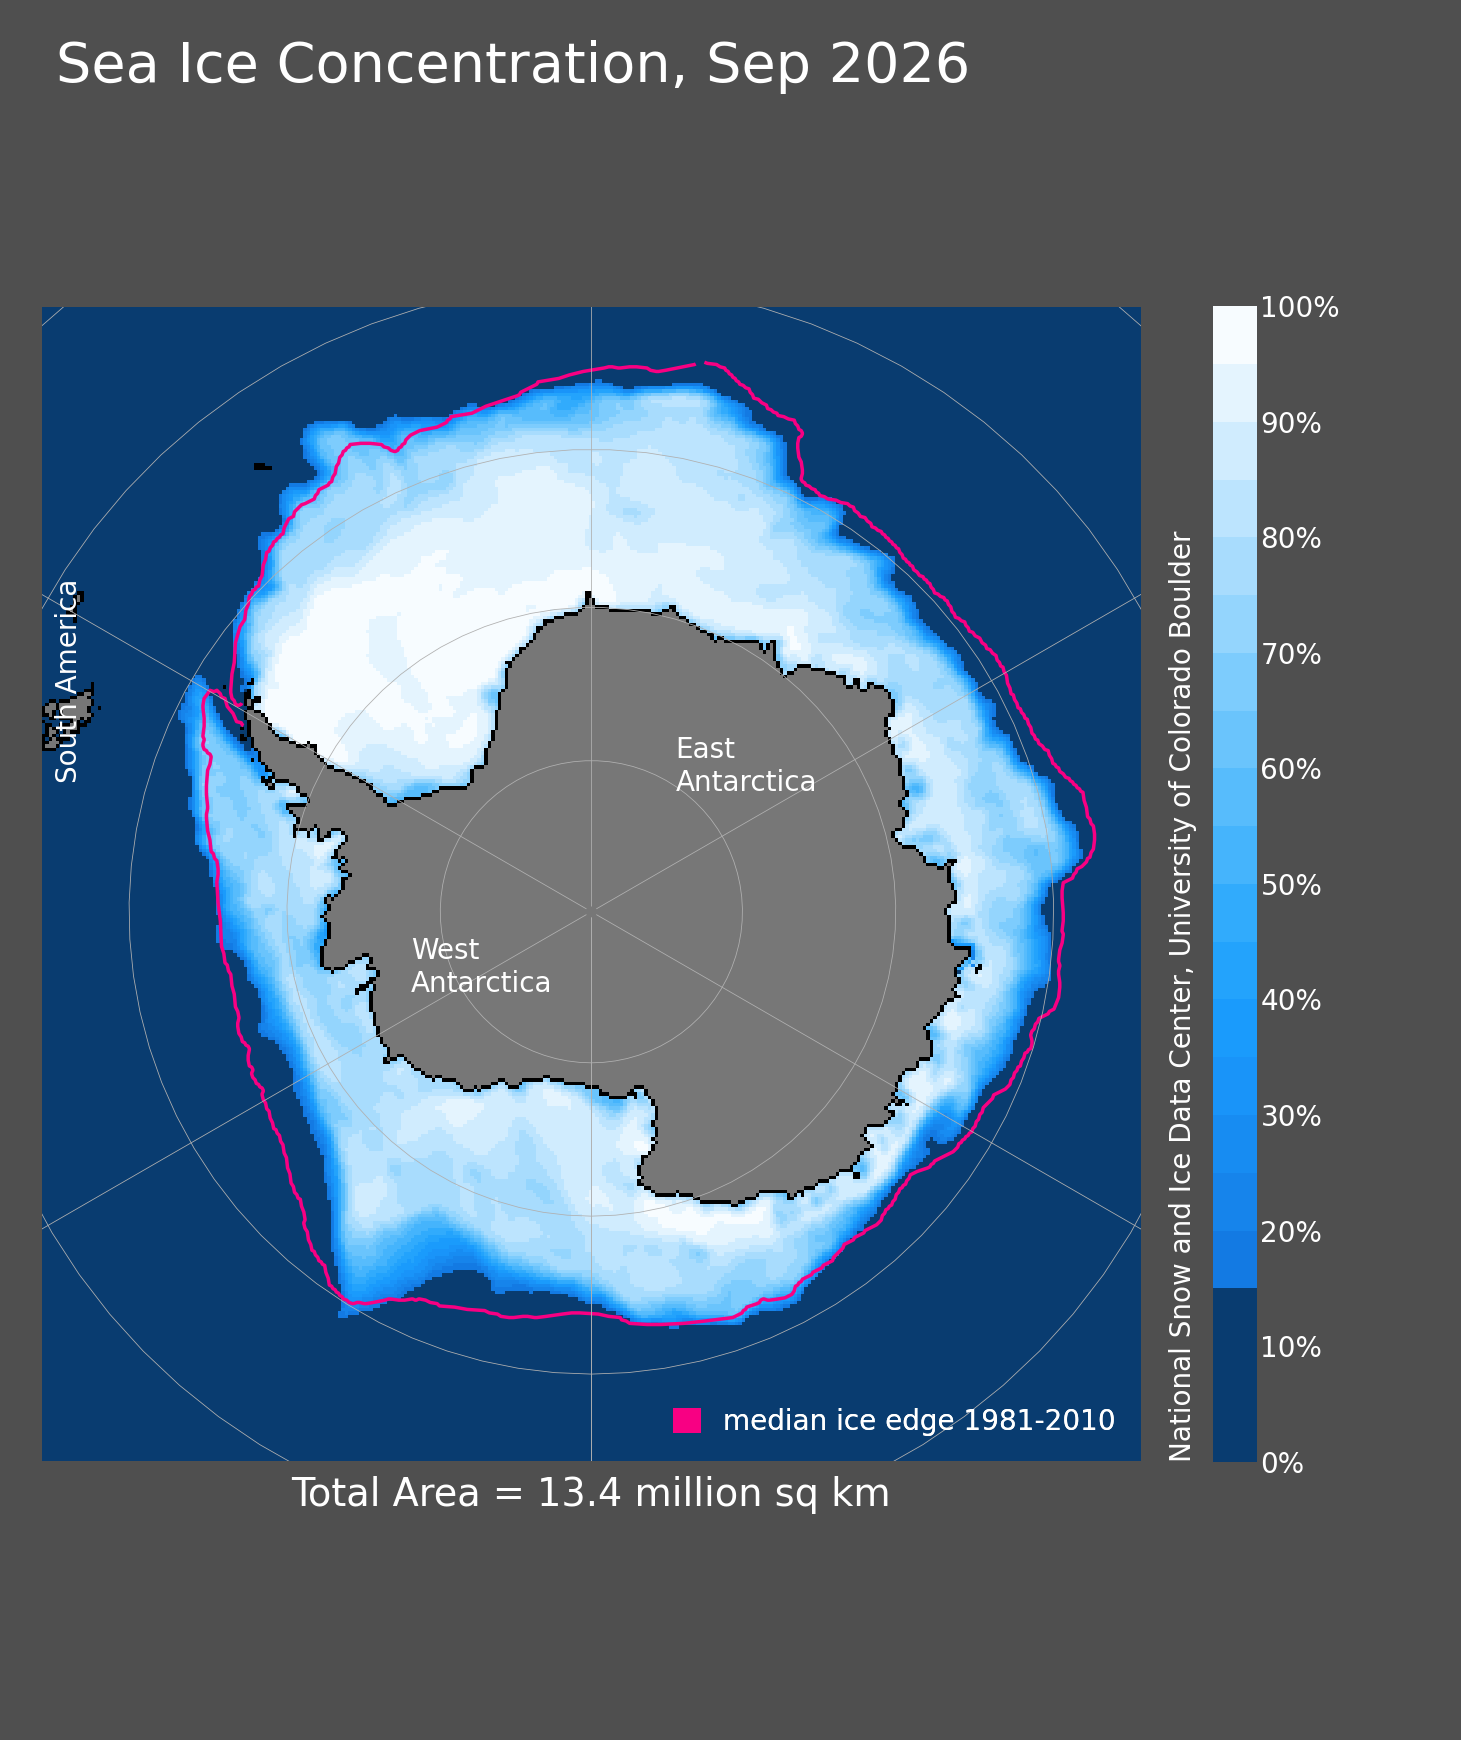
The four core daily Sea Ice Index maps are displayed directly rather than hidden behind resource links.
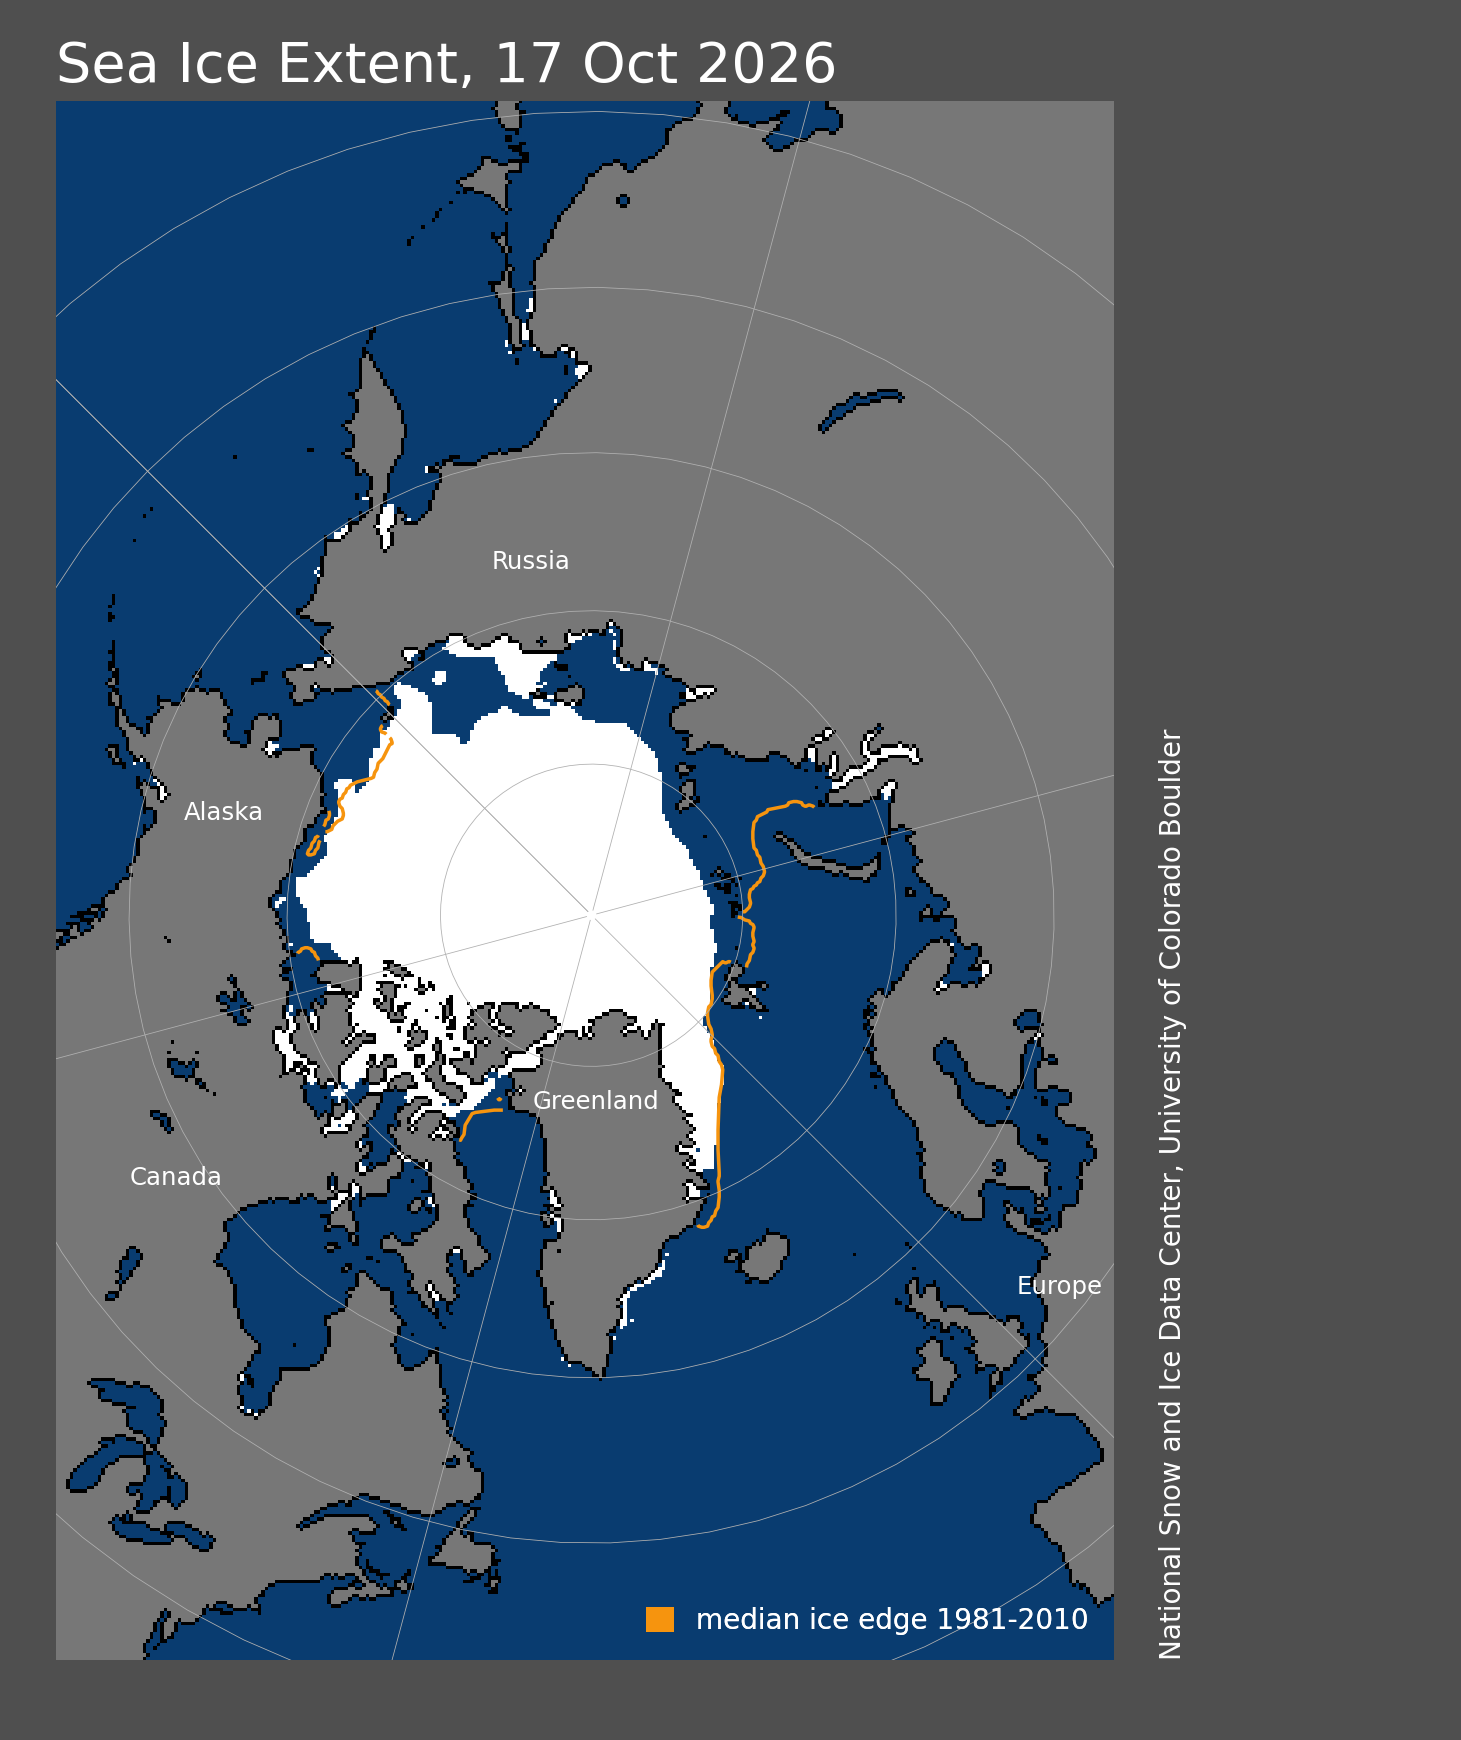
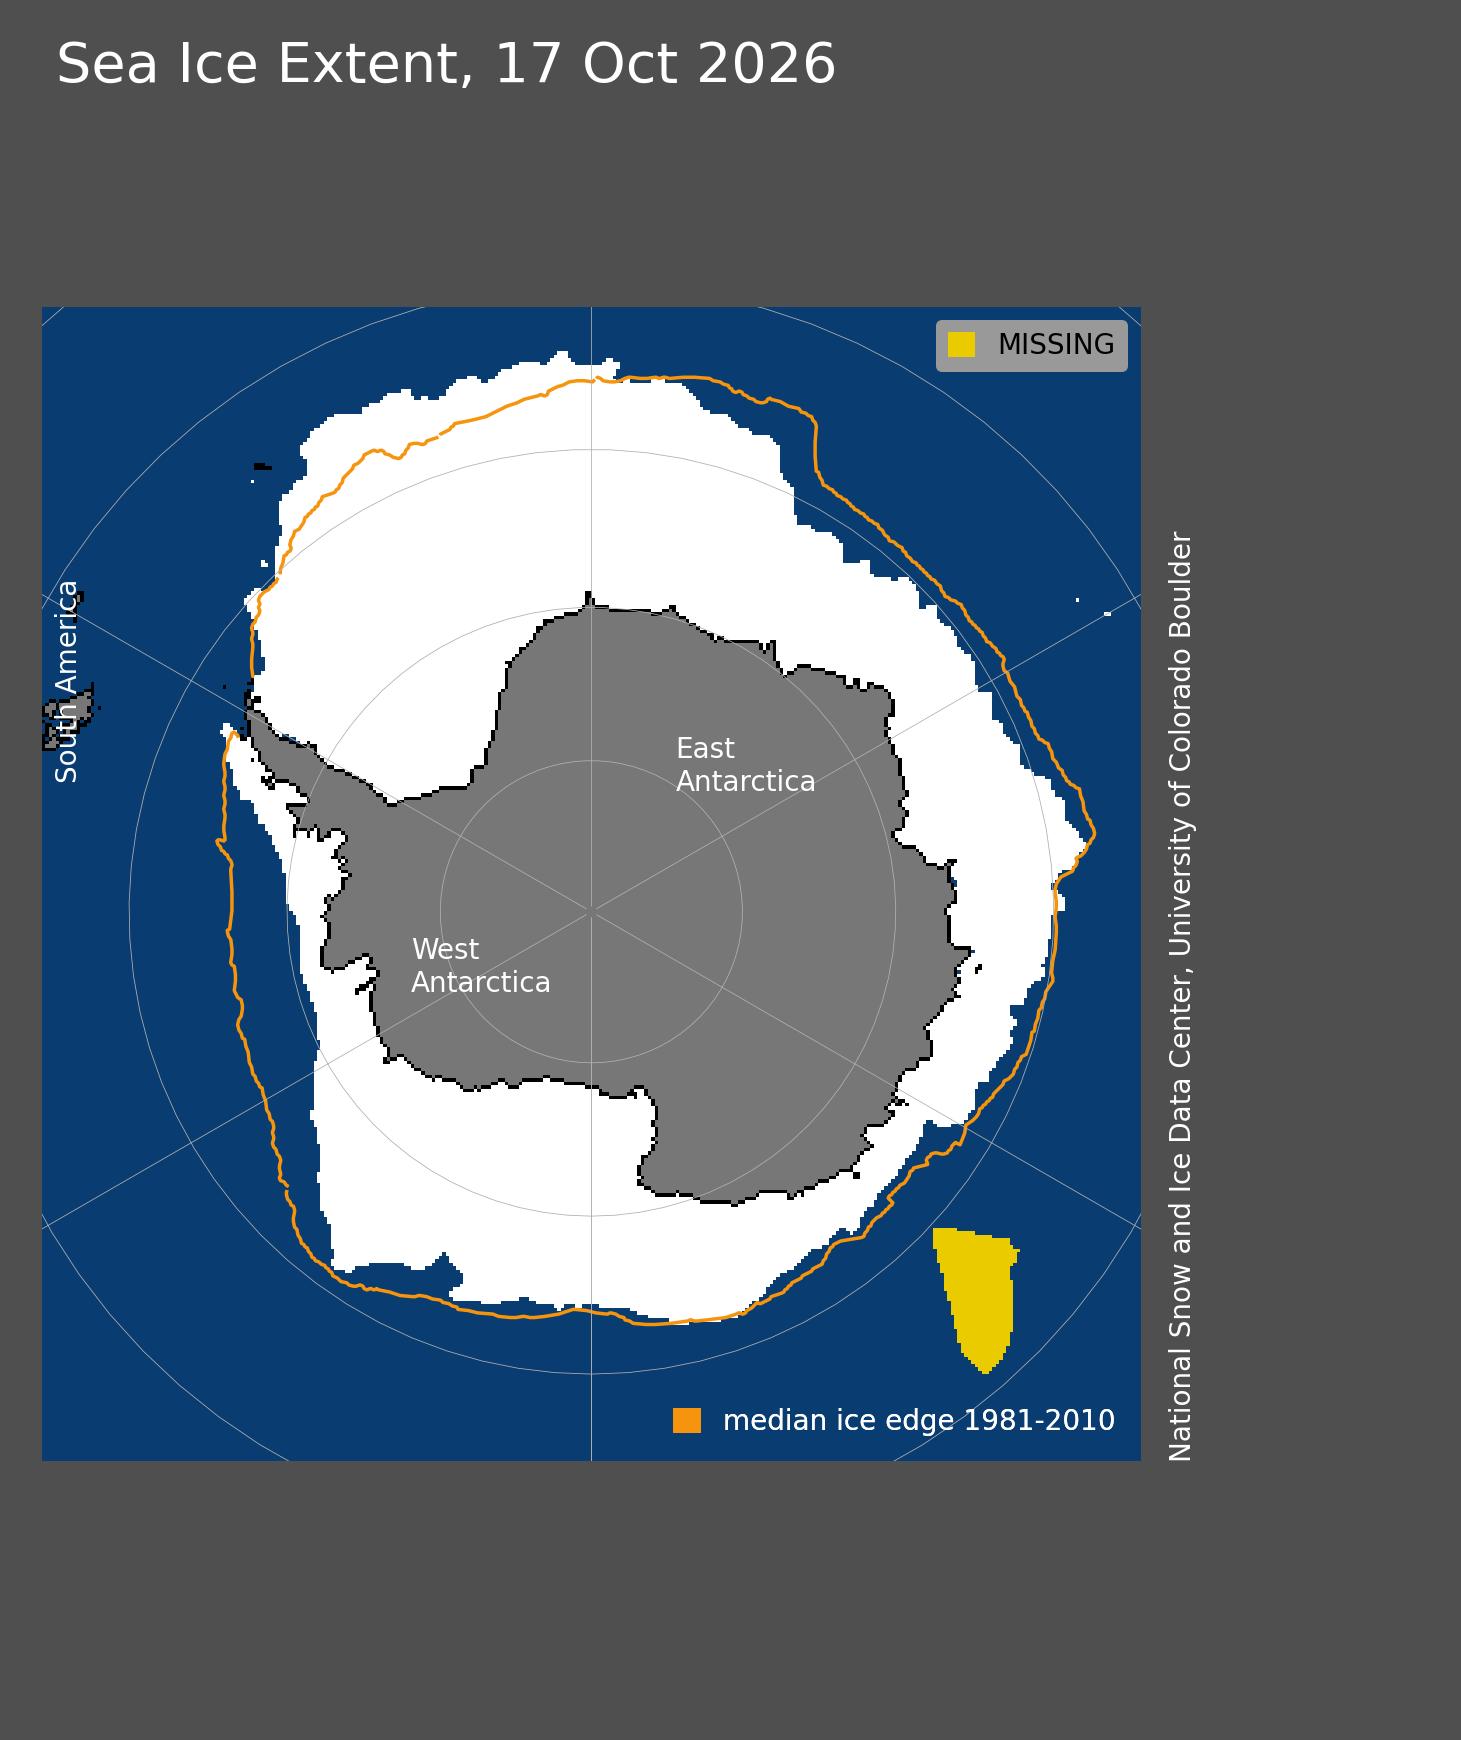
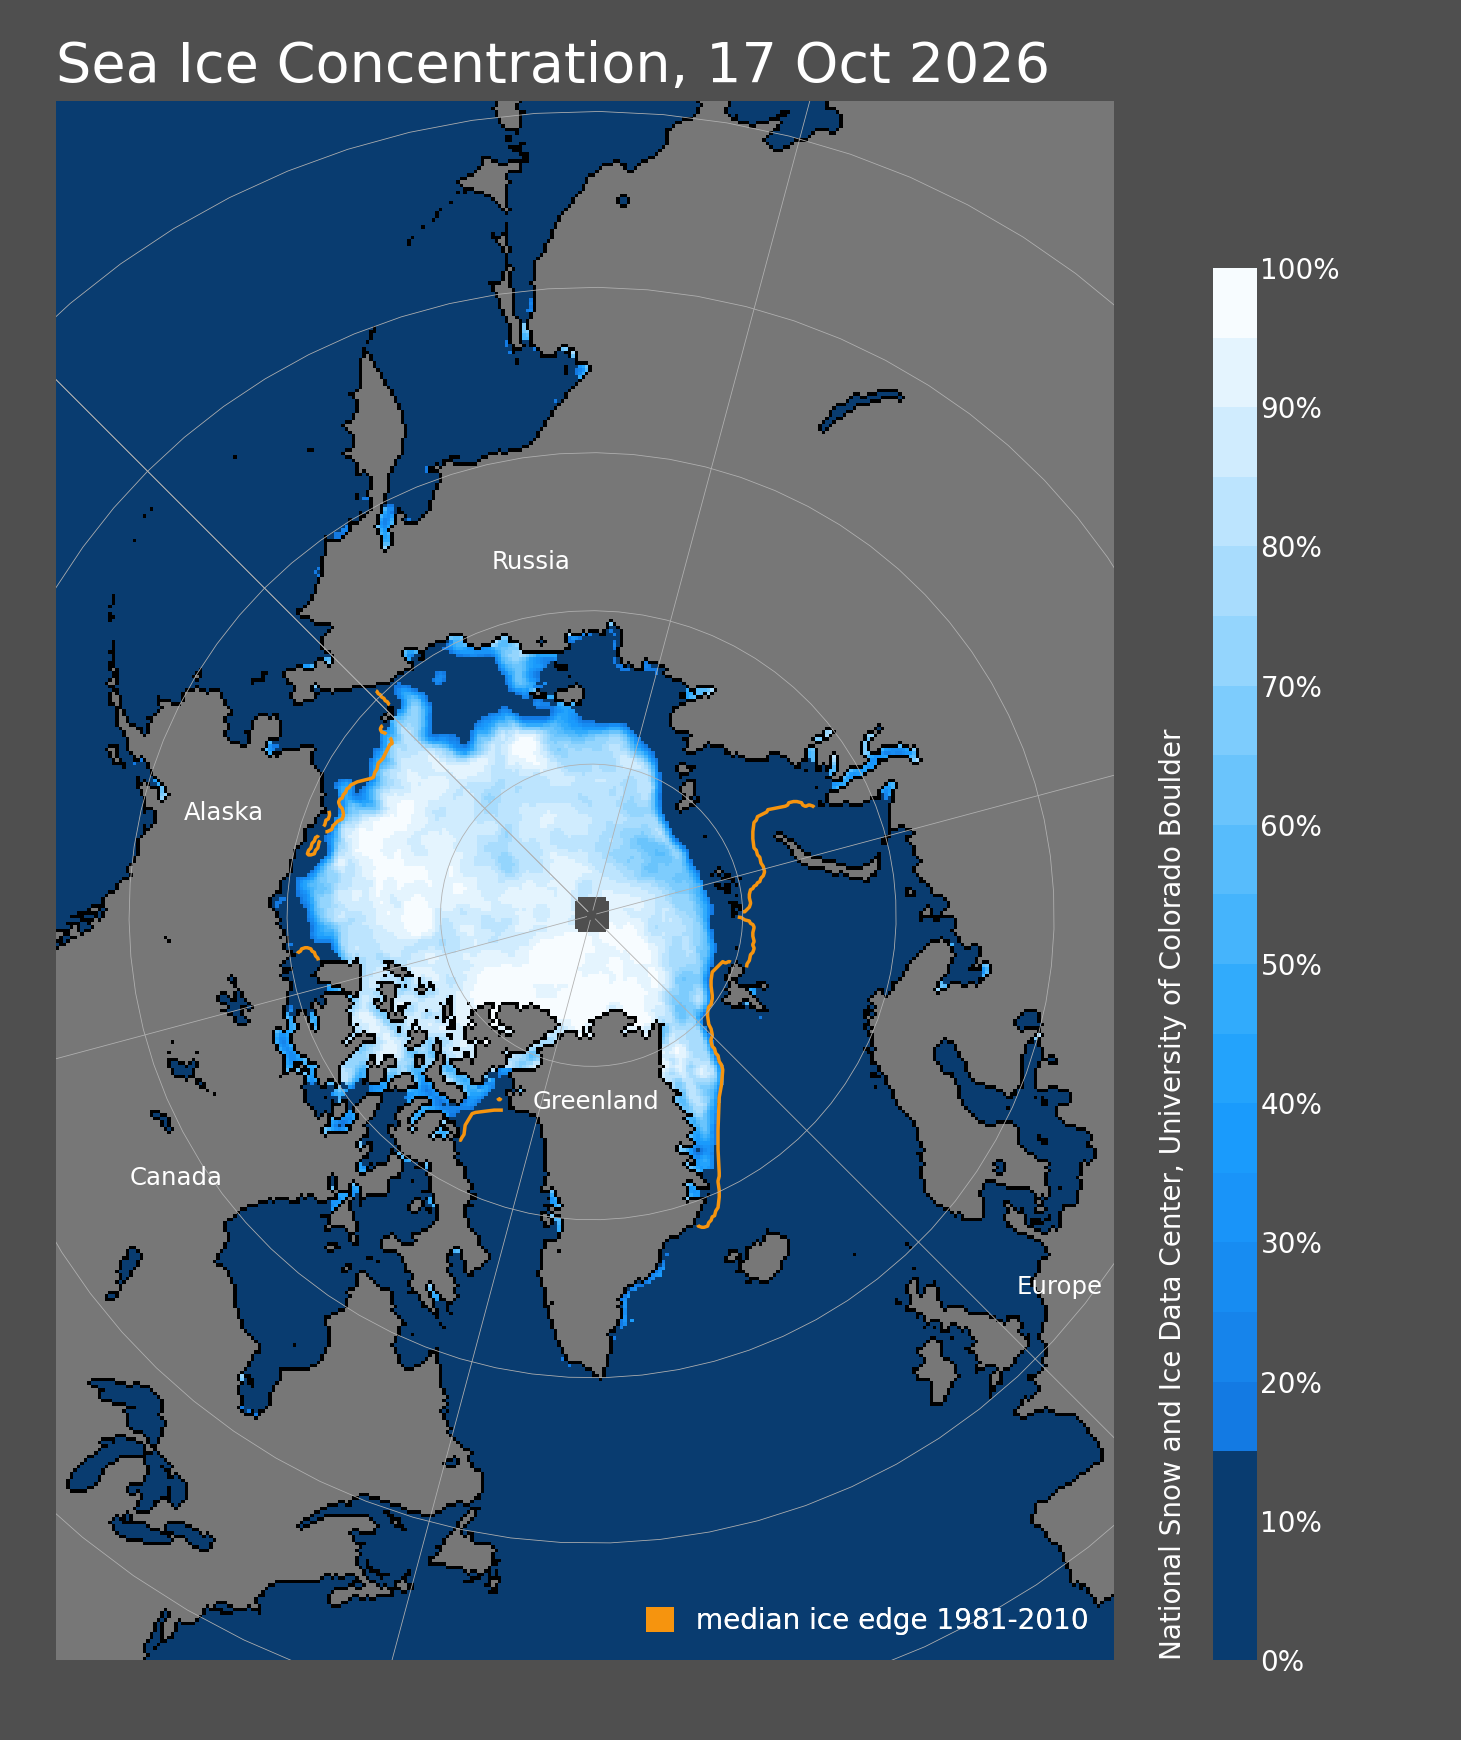
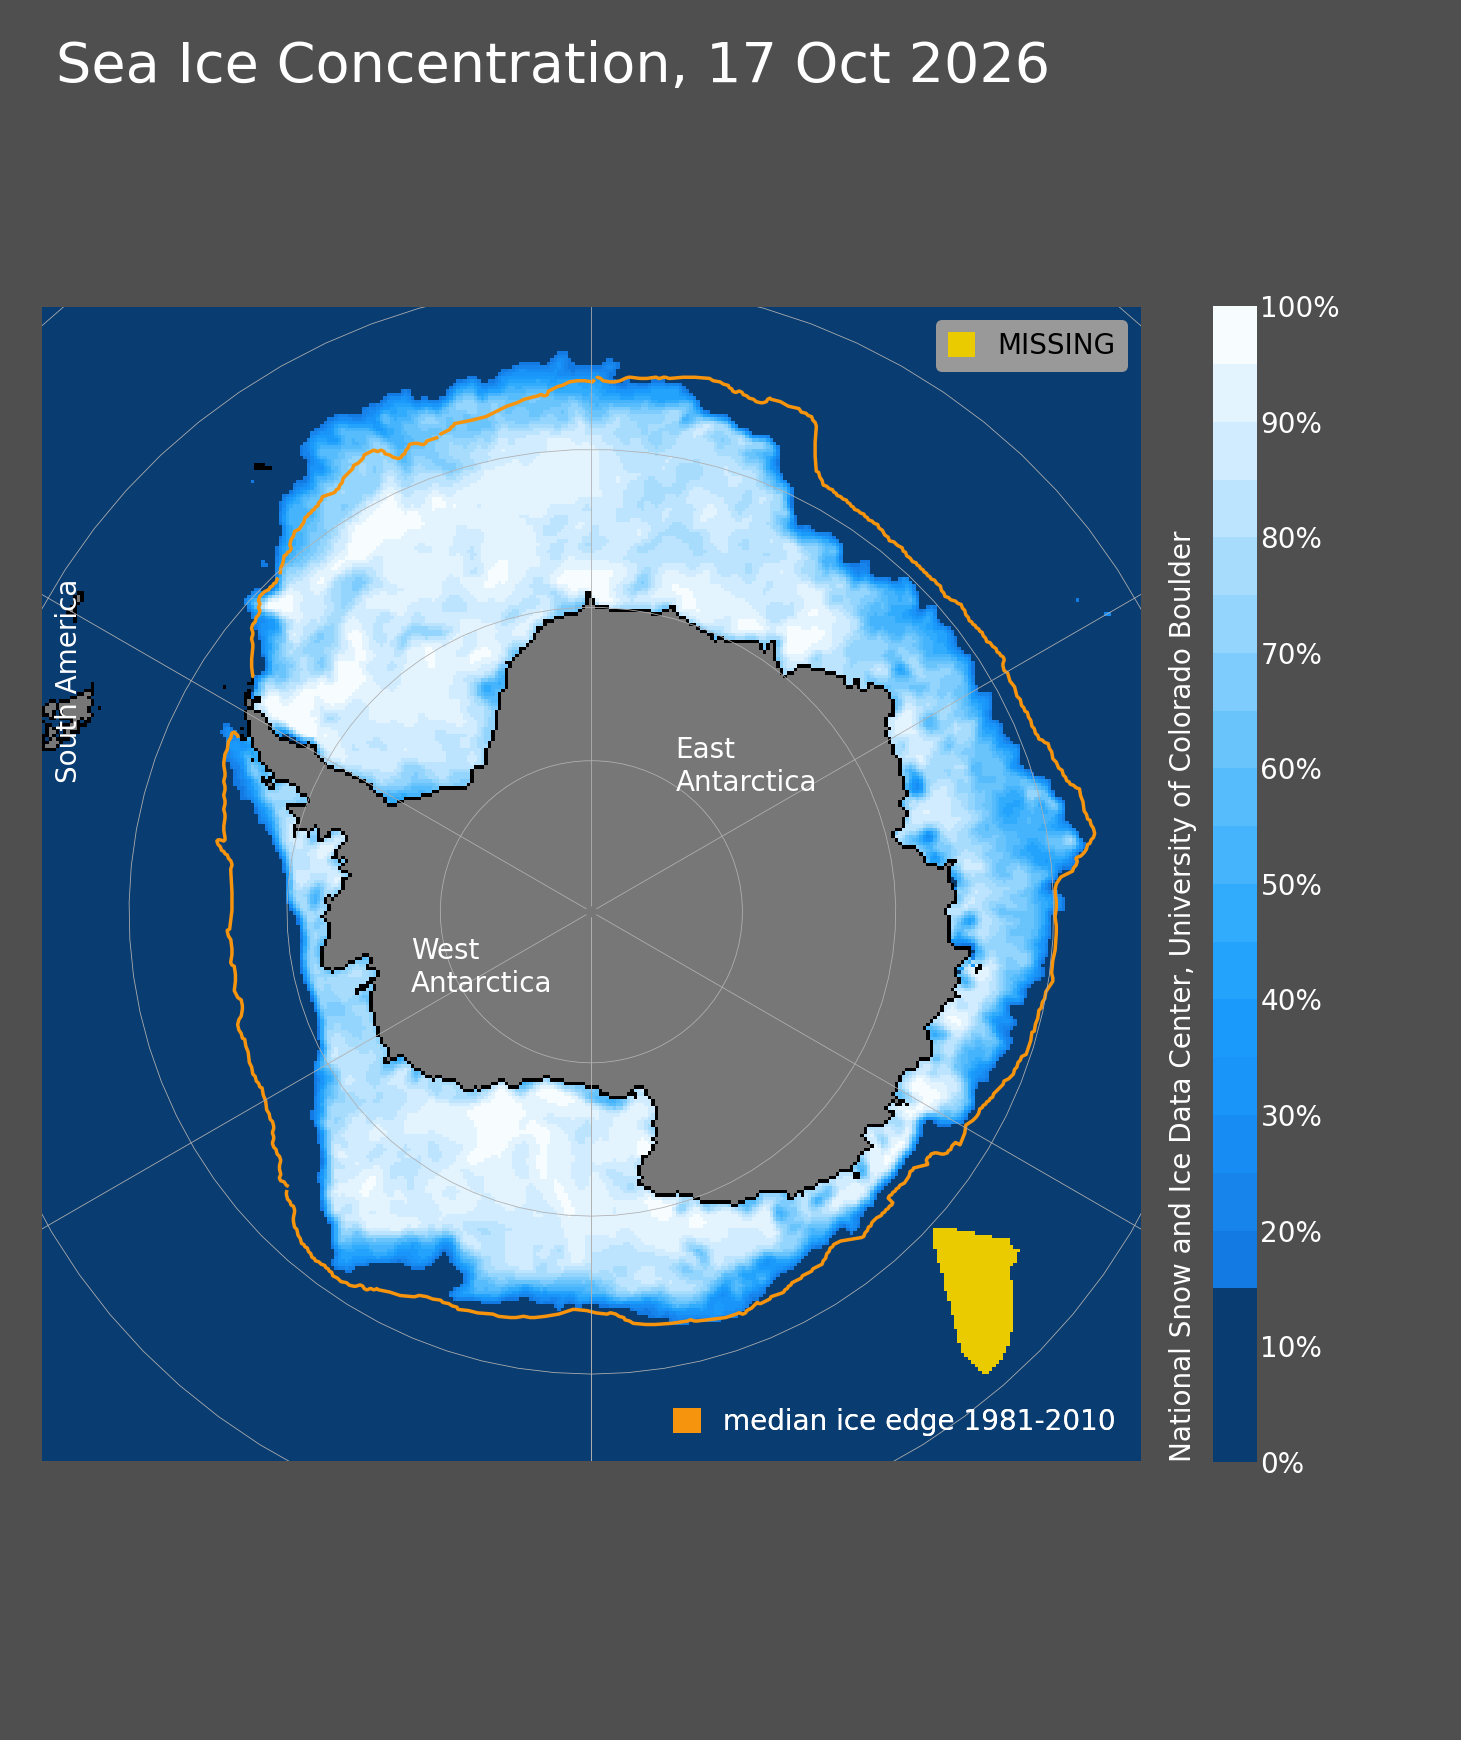
Extent • Concentration • Anomaly • Trend
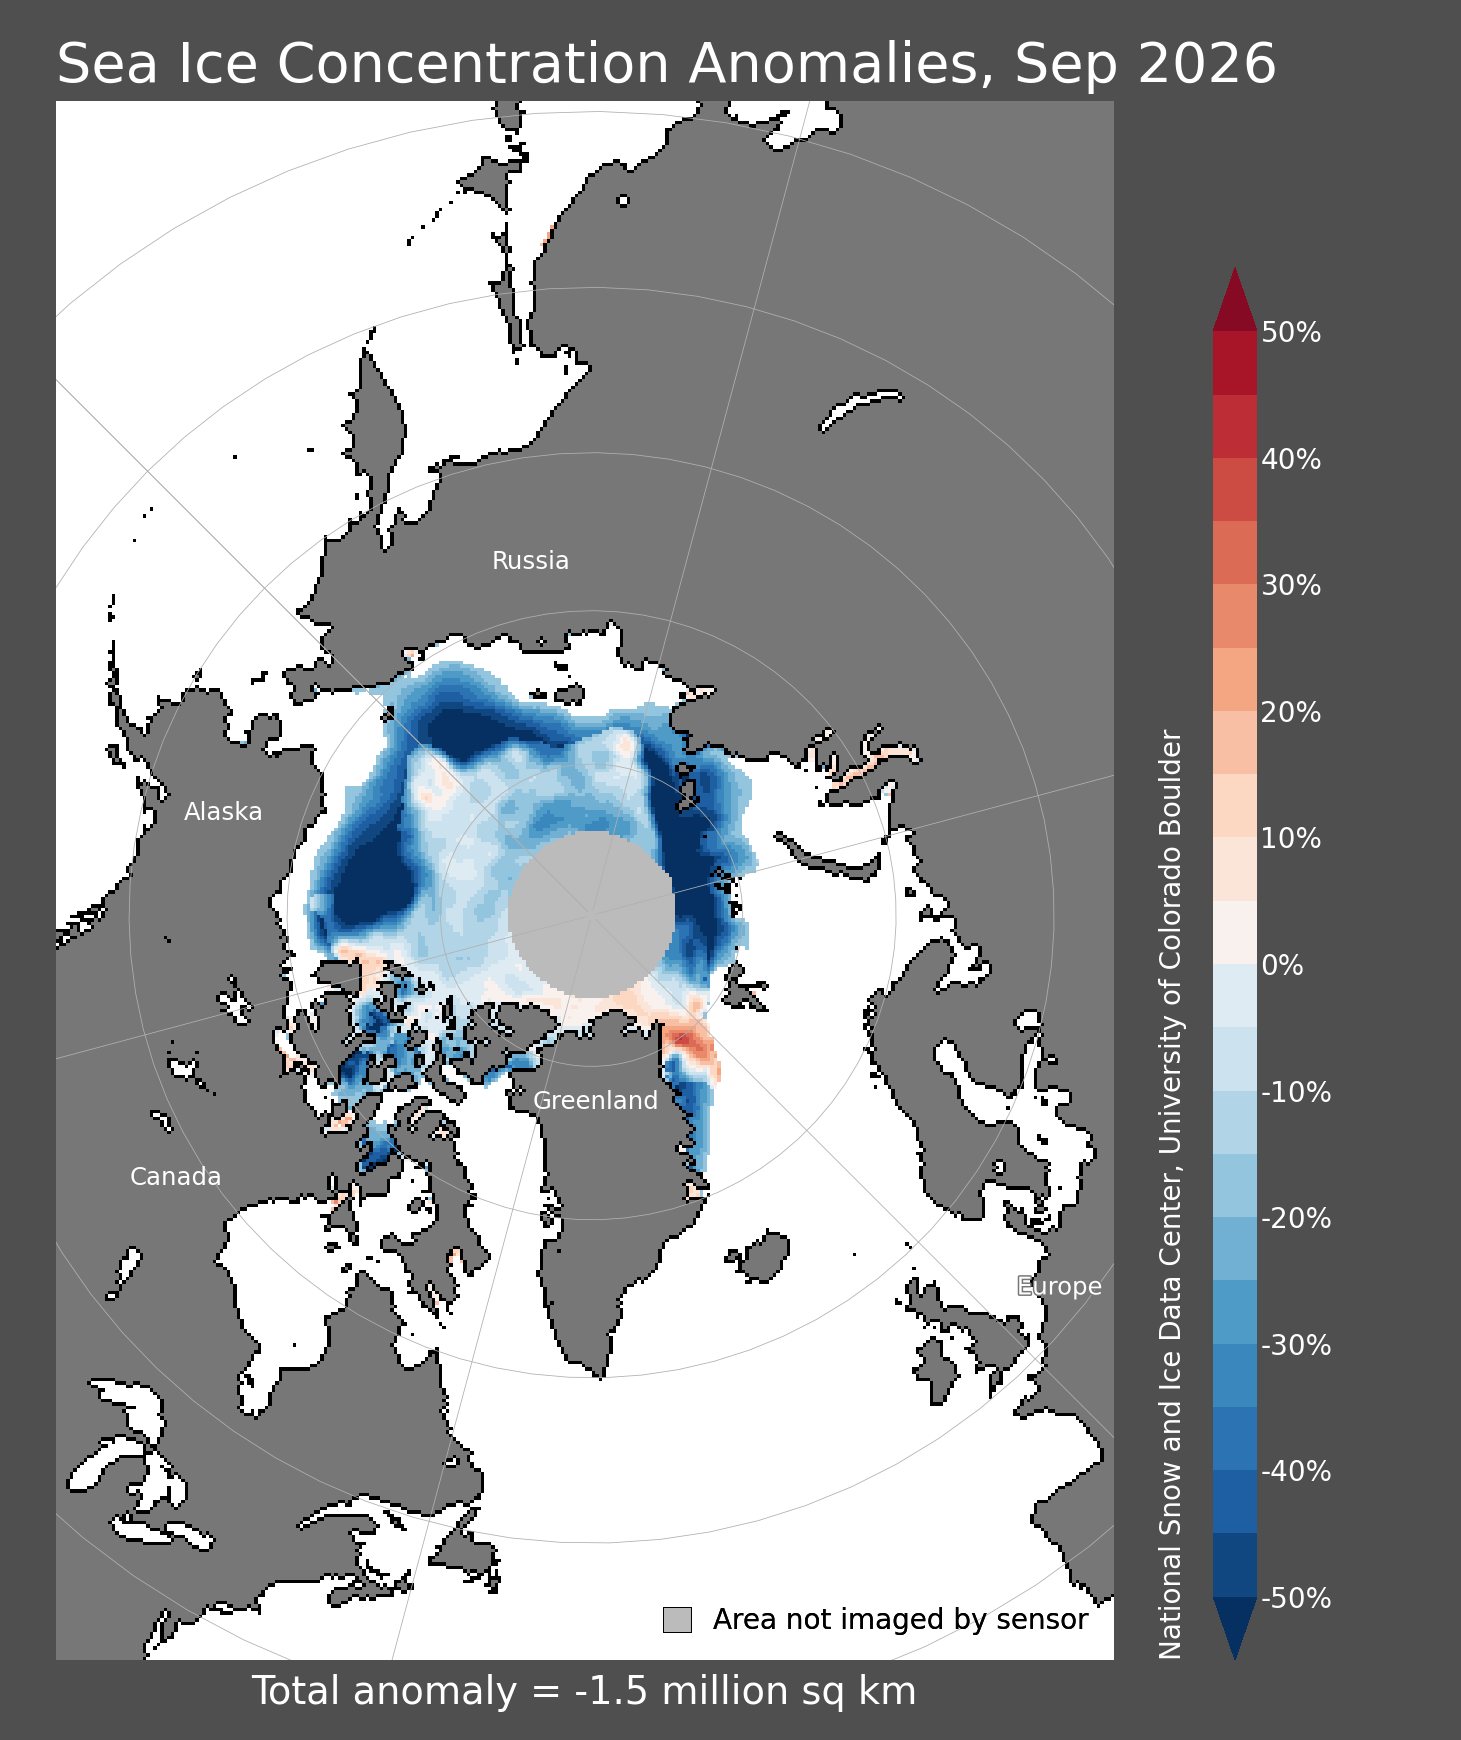
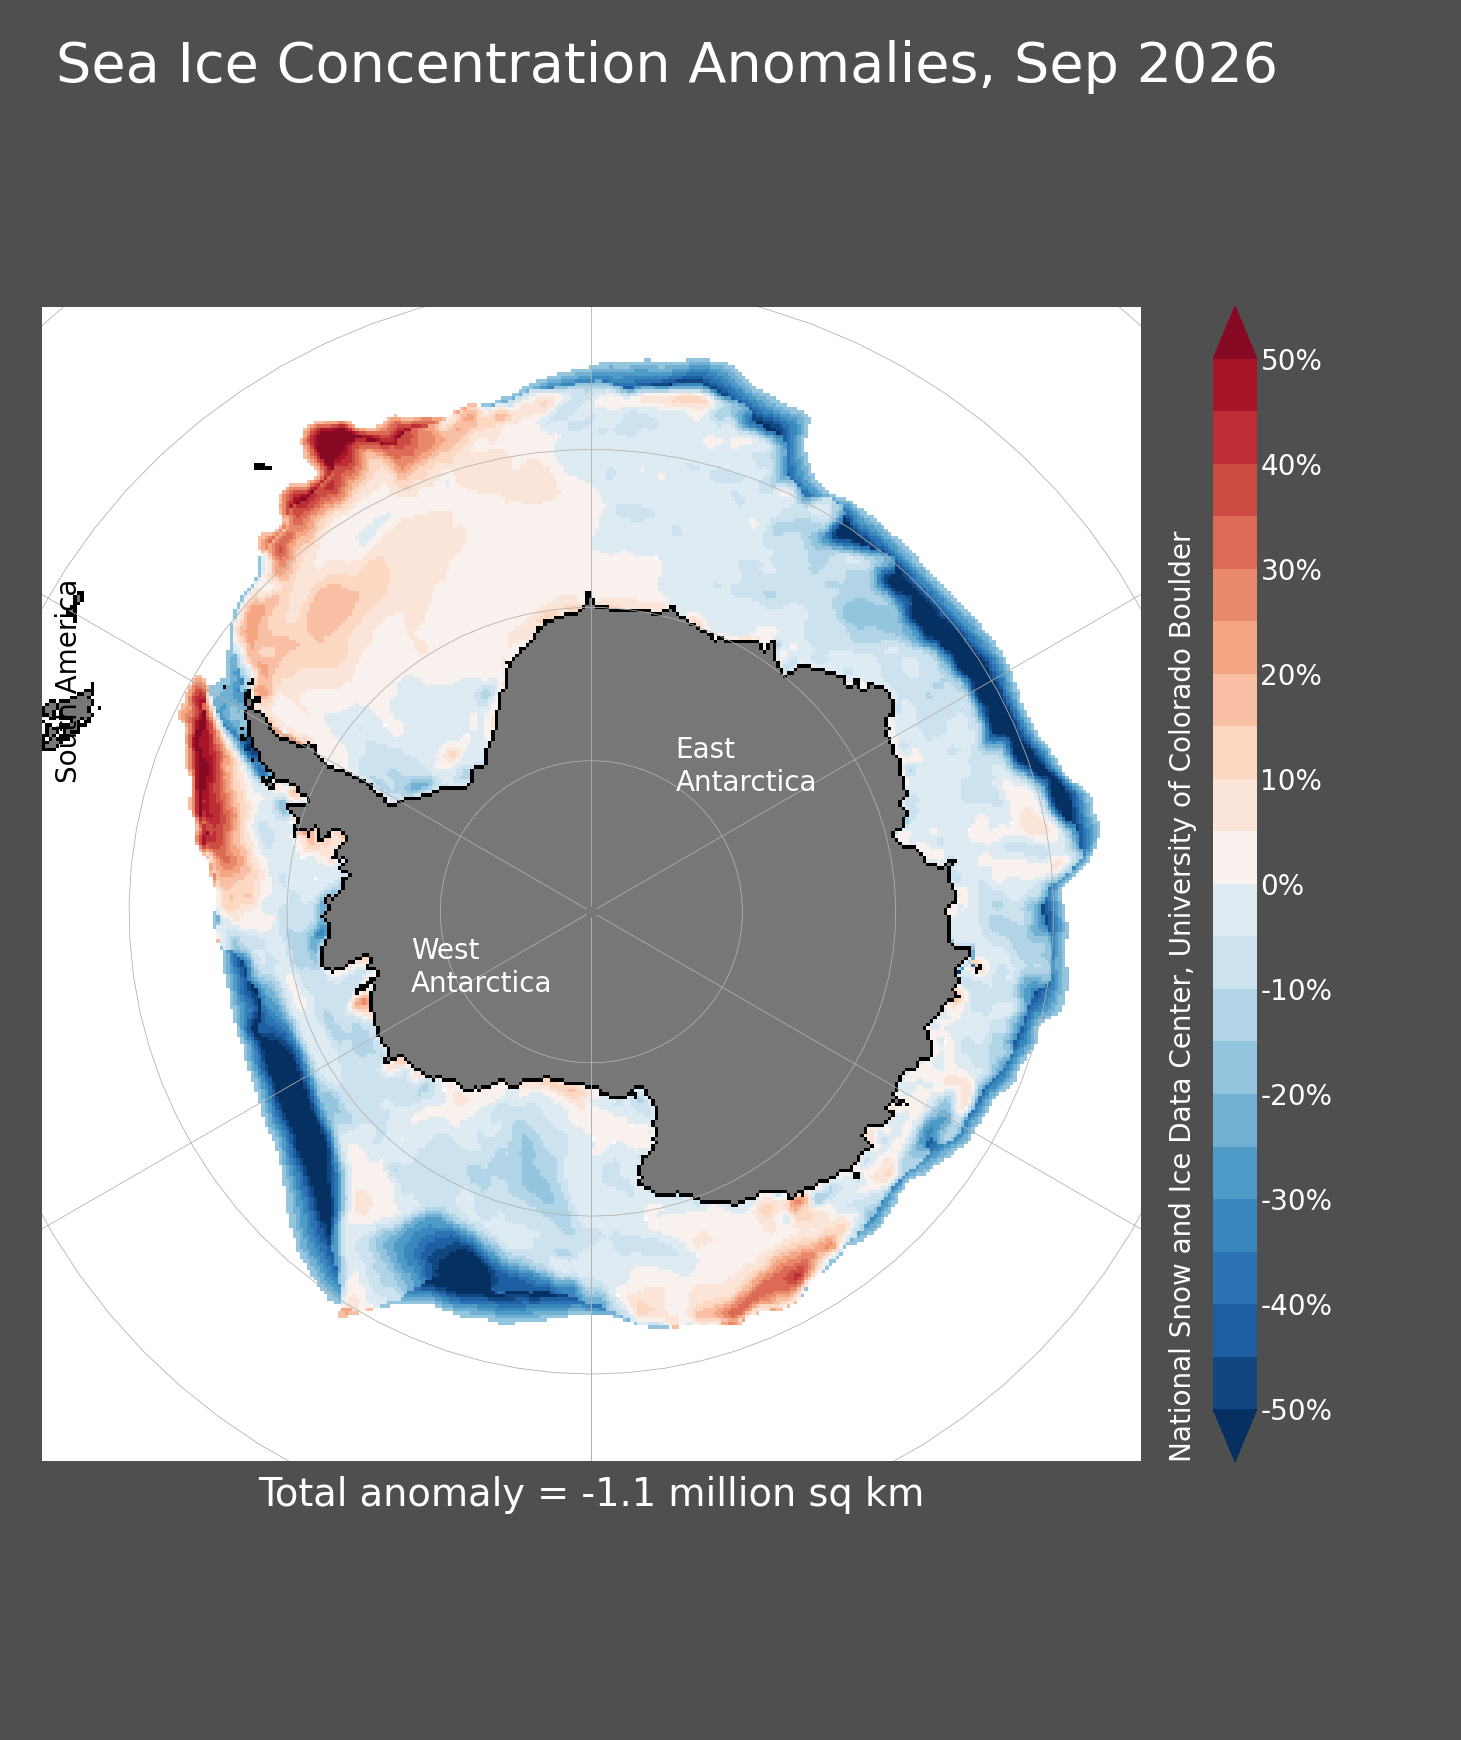
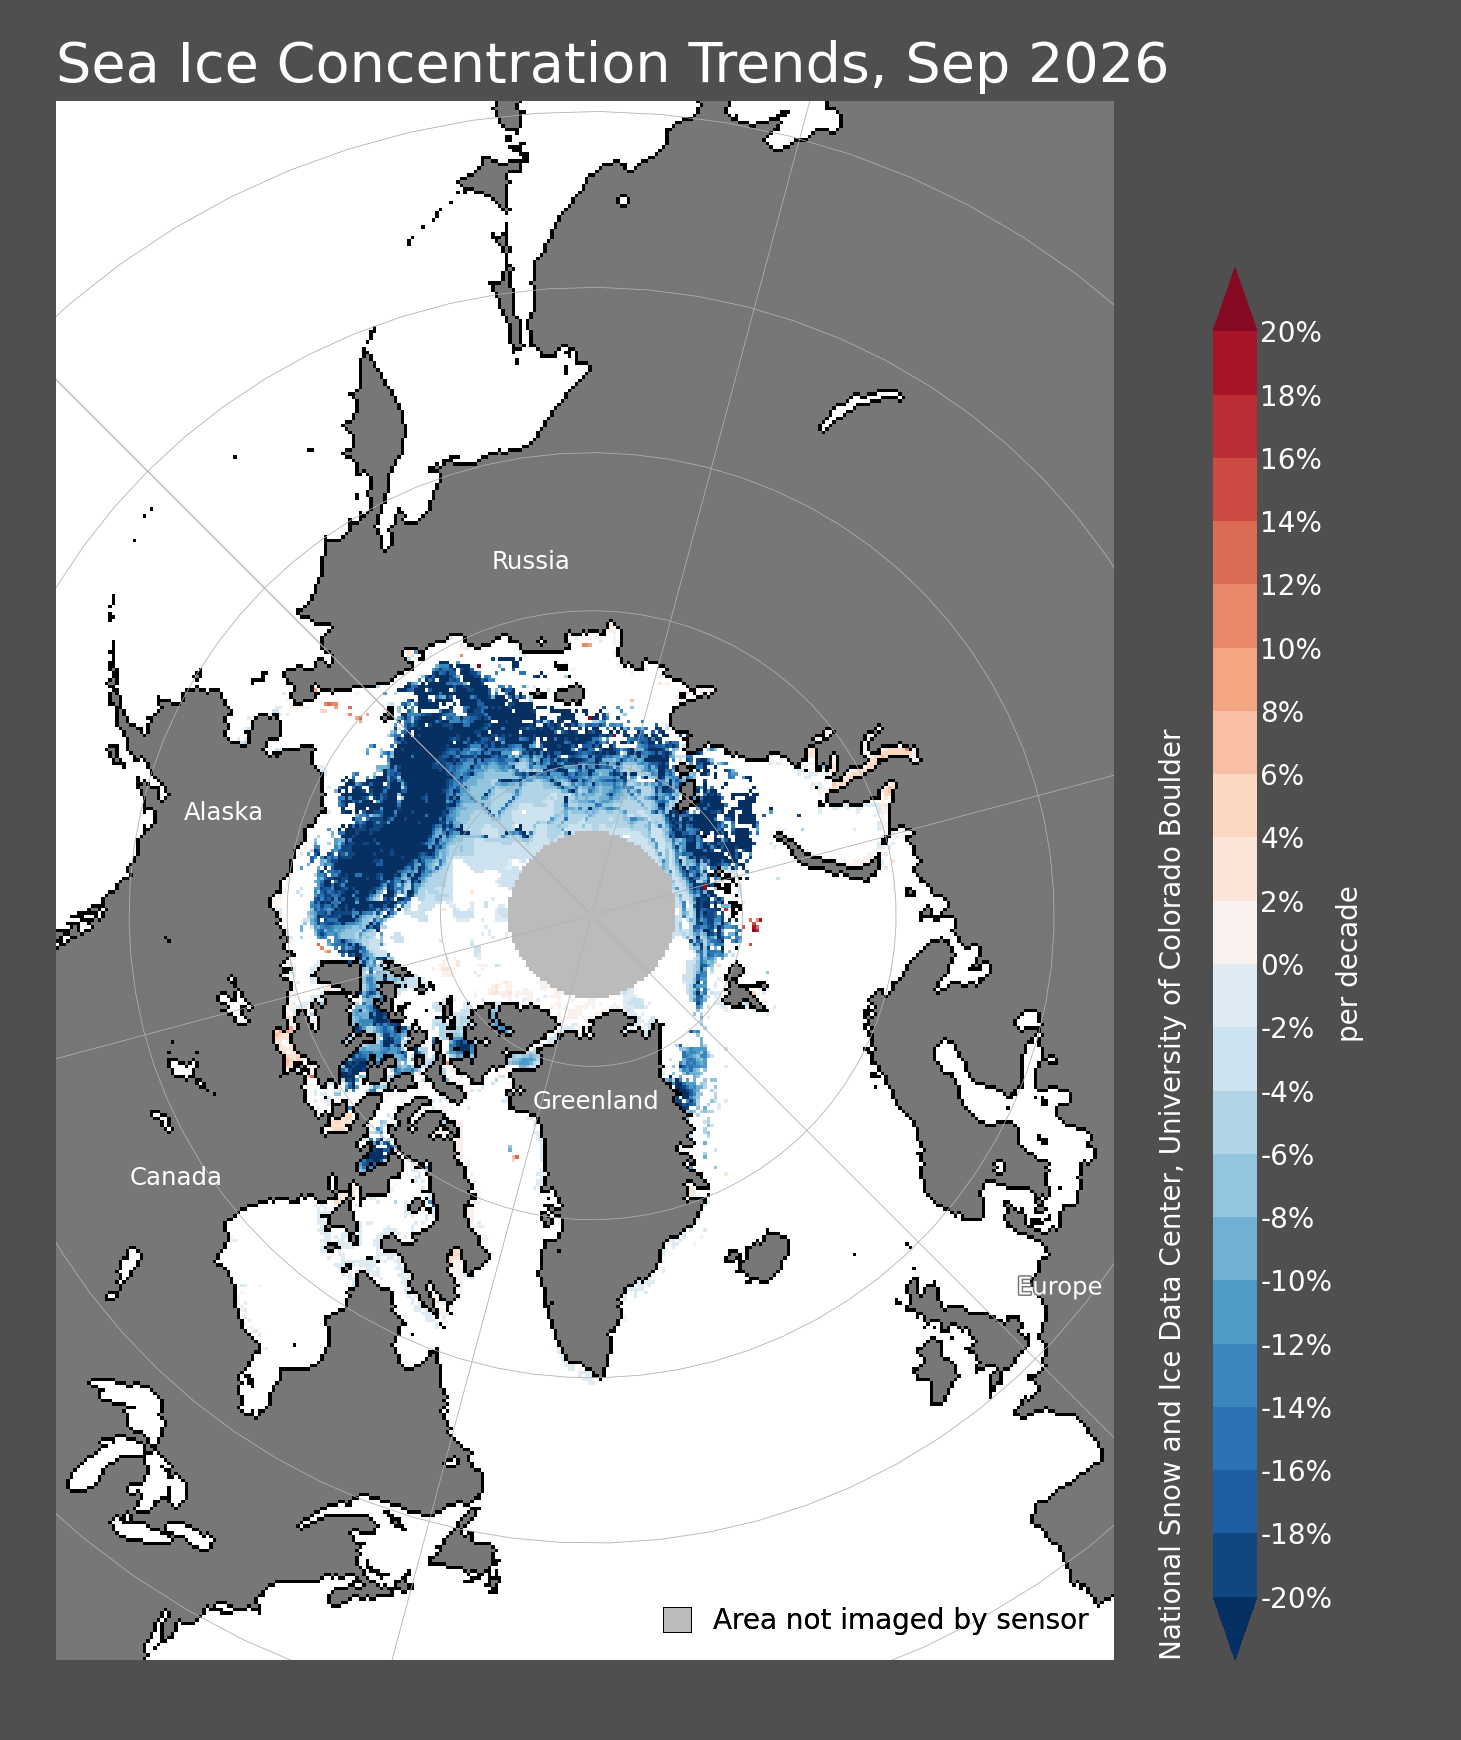
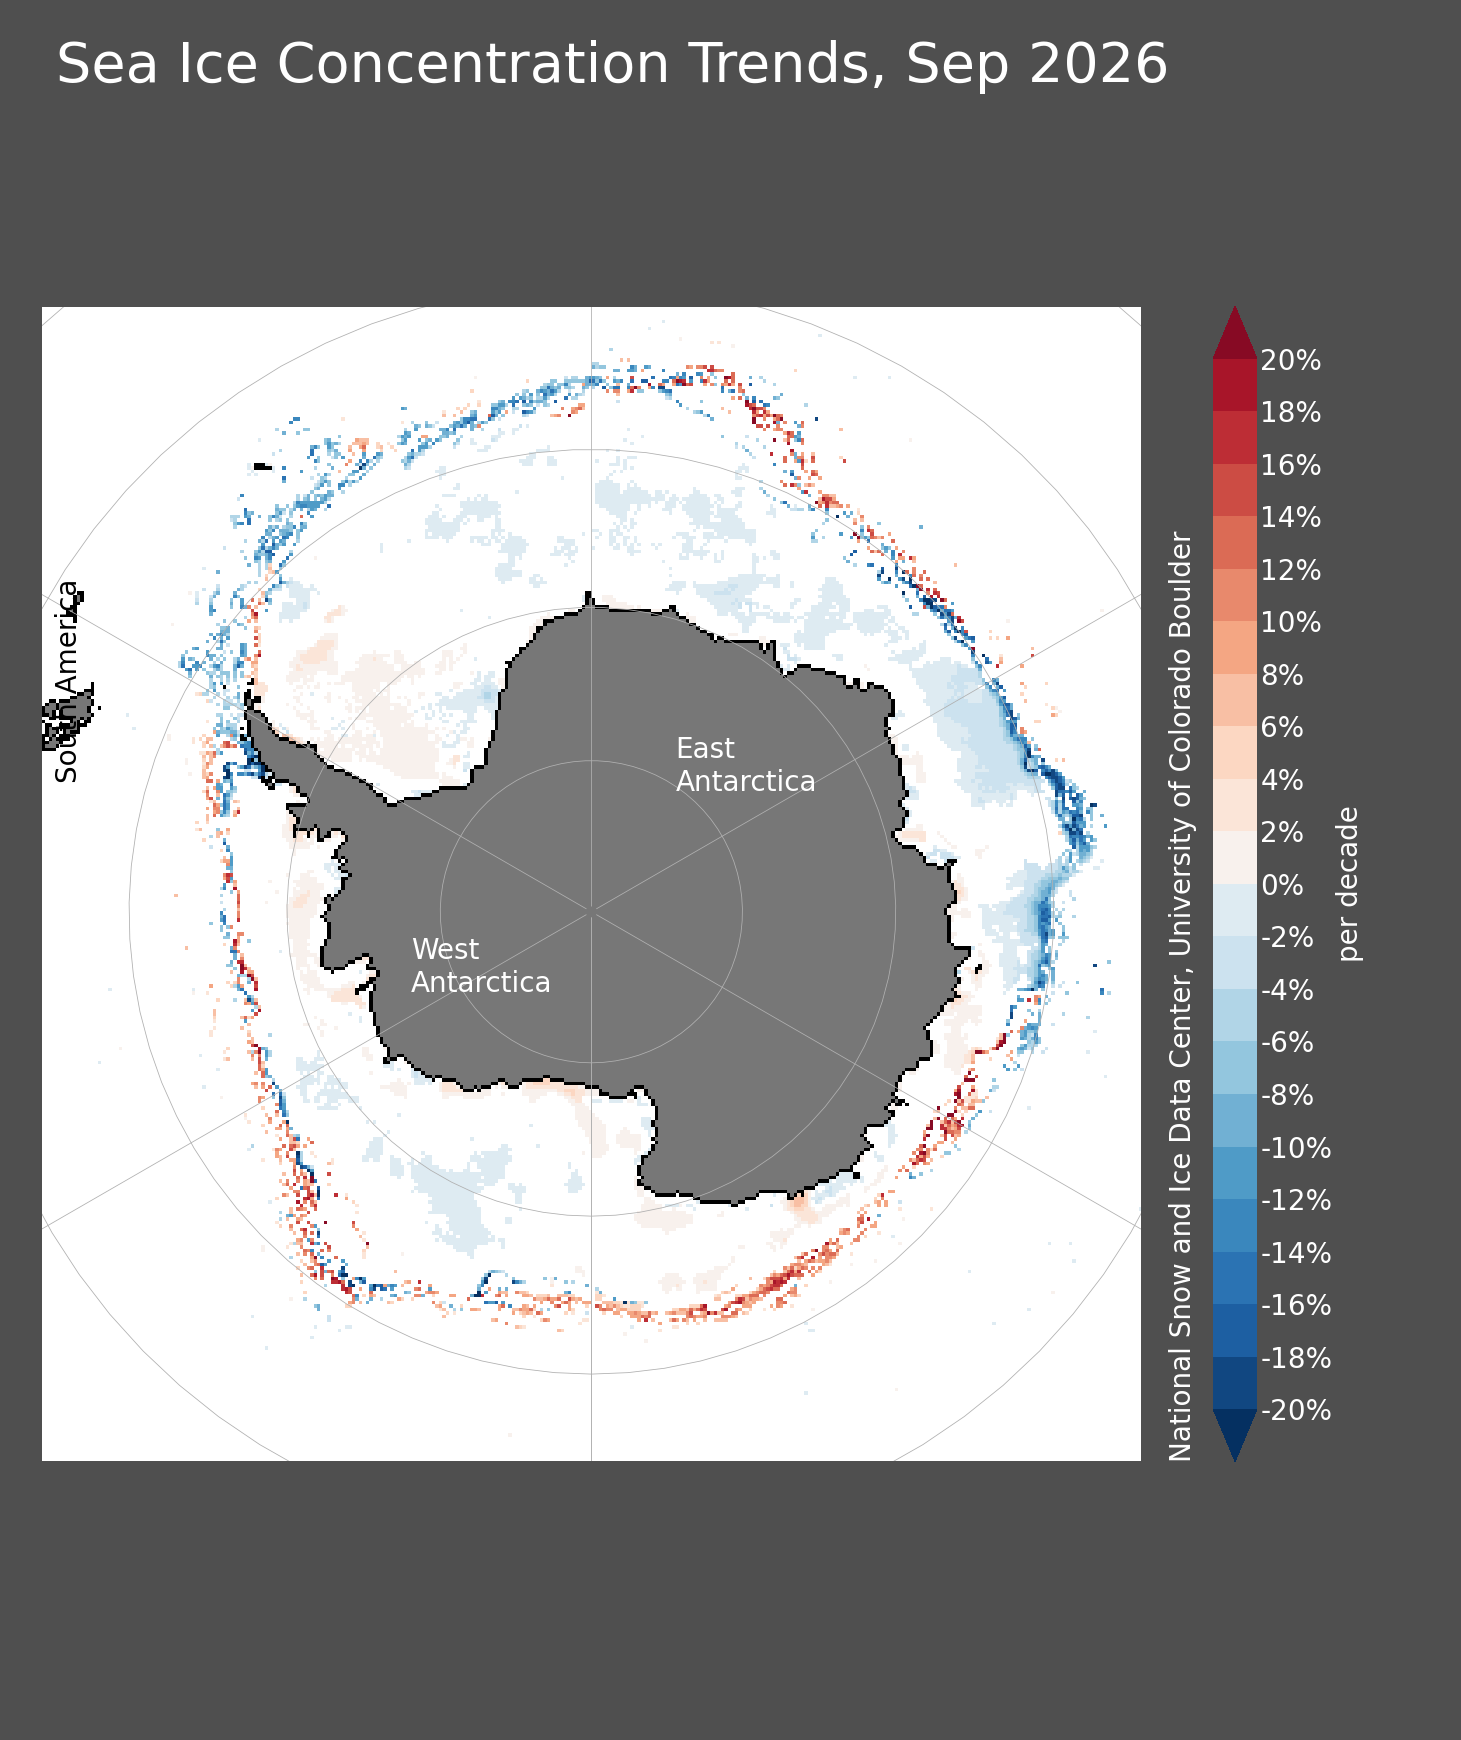
Latest completed-month products for both hemispheres.
Viewer, Data & Comparison
The full NSIDC tools remain available in addition to the data shown above.
Daily and monthly Arctic/Antarctic extent, concentration, anomalies and trends.
Open source ↗DatasetSea Ice Index Version 4Source data, methods and documentation for the long-term record.
Open source ↗CompareCharctic Interactive GraphCompare Arctic and Antarctic daily extent across years.
Open source ↗ArchiveSea Ice Index Data ArchiveArchived daily/monthly images, CSV data and GIS files.
Open source ↗Additional Sea-Ice Products
These complement the 25-km Sea Ice Index with operational and higher-resolution products.
Operational Arctic sea-ice extent from the U.S. National Ice Center, including regional products.
Open source ↗4 km ArcticMASAM2 Version 2Daily 4-km Arctic sea-ice concentration with PNG and netCDF products.
Open source ↗Global NRTNISE Version 5Near-real-time daily global sea-ice concentration and snow extent.
Open source ↗Raw DataNOAA@NSIDC Sea Ice ArchiveDirect access to Sea Ice Index images, CSV values and source files.
Open source ↗Concentration vs. Extent
The two measurements describe different aspects of the ice cover.
Percentage of each roughly 25-km grid cell covered by sea ice.
Total ocean area with at least 15% sea-ice concentration.
Departure from the 1981–2010 climatological concentration for the month.
Longer-term concentration change, expressed as percent change per decade.